I’ve always been fascinated by the power of candlestick charts in technical analysis. Developed in 18th century Japan, these visual representations of price data have become essential tools for traders worldwide. By understanding how to read these charts, you can gain valuable insights into market psychology and make more informed trading decisions.

As we explore the world of candlestick charts, you’ll discover how various patterns reveal the ongoing battle between buyers and sellers in the market. This knowledge will help you identify potential market turning points with greater confidence. My goal is to share practical techniques that make candlestick analysis accessible to you, whether you’re a beginner or an experienced trader.
Key Takeaways
- Understand the basics of candlestick charts and their significance in technical analysis.
- Learn to identify key patterns that indicate market sentiment.
- Discover how to apply candlestick analysis to improve your trading decisions.
- Gain insights into the ongoing battle between buyers and sellers in the market.
- Develop a personal approach to reading candlestick charts effectively.
The Origins and History of Candlestick Charts
The origins of candlestick charts are deeply rooted in Japan’s financial history, particularly in rice trading. For centuries, Japanese traders used these charts to analyze and predict price movements in the rice market.
The Japanese Rice Trading Connection
In the 18th century, Japanese rice traders pioneered a unique method of charting price movements using candlesticks. This technique was developed by a legendary rice trader named Munehisa Homma, who is often credited with creating the first candlestick charts. Homma’s innovative approach to analyzing price movements using candlestick patterns allowed him to predict future market trends with remarkable accuracy. The use of candlestick charts remained a staple of Japanese trading for centuries, providing valuable insights into market sentiment and price movements.
Introduction to Western Markets by Steve Nison
The use of candlestick charts remained confined to Japan until Steve Nison introduced them to Western financial markets in the late 20th century. Nison’s research and teachings highlighted the power of candlestick formations in predicting price movements, leading to widespread adoption among traders across stocks, forex, and commodities markets. As Nison noted, “Candlestick charting is not just a technique, it’s a language that provides a unique perspective on market psychology.”
“The power of candlestick charts lies in their ability to convey complex market information in a simple, visual format.”
| Key Features | Description |
|---|---|
| Candlestick Charts Origin | 18th-century Japan, used for rice trading |
| Introduced to West | Late 20th century by Steve Nison |
| Primary Use | Predicting price movements and market sentiment |
As we explore the history of candlestick charts, it becomes clear that their introduction to Western markets by Steve Nison was a pivotal moment in the evolution of technical analysis. By bridging Eastern and Western trading philosophies, Nison’s work created a universal language for traders worldwide.
Understanding the Anatomy of a Candlestick Chart
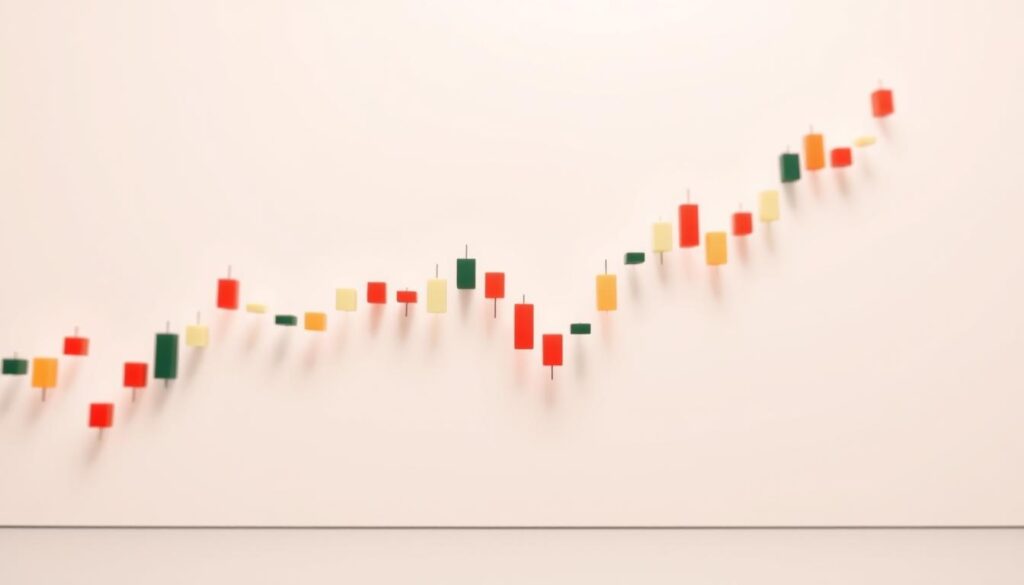
Let’s dive into the structure of a candlestick chart, a fundamental element in trading decisions. Acandlestick chartis made up of individualcandles, each representing a specific time period. To understand how to read these charts, we need to break down their components.
The Real Body: What It Reveals About Market Sentiment
The real body of a candle represents the difference between the opening and closing price. A large body indicates strong market sentiment, either bullish or bearish. The color and size of the body provide insights into whether buyers or sellers dominated during the period.
Shadows (Wicks): Interpreting Price Extremes
Shadows, or wicks, are the lines extending from the top and bottom of the candle’s body. They represent the highest and lowest price reached during the period. Long shadows can indicate significant price movements and potential reversals.
Color Coding: Bullish vs. Bearish Signals
The color of the candlestick is crucial for quick analysis. A bullish candlestick, typically green or white, indicates that the closing price was higher than the opening price, showing upward momentum. Conversely, a bearish candlestick, usually red or black, signals a lower closing price compared to the opening, reflecting downward pressure.
| Candlestick Color | Market Sentiment | Price Movement |
|---|---|---|
| Green/White | Bullish | Closing price higher than opening |
| Red/Black | Bearish | Closing price lower than opening |
How to Read a Candlestick Chart
Deciphering candlestick charts can seem daunting, but it’s a skill that can be learned with practice. As we explore the world of candlestick analysis, you’ll discover that it’s not just about recognizing patterns; it’s about understanding the story behind the price movements.
The Four Critical Price Points: Open, High, Low, and Close
The foundation of reading a candlestick chart lies in understanding the four critical price points: open, high, low, and close. By analyzing these points over multiple candlesticks, traders can gaugemarket sentimentand how the bulls and bears are faring against each other. This analysis helps predict potentialprice changes. For instance, a candlestick with a high close and a low open indicates a bullish trend, while the opposite suggests a bearish trend.
Identifying Trends and Market Momentum
To identify emergingtrends, look for specific sequences of candlesticks that signalmomentumbuilding. You can spot early warning signs of trend exhaustion by recognizing candlestick formations at market tops and bottoms. The size and relationship of consecutive candlesticks reveal acceleration or deceleration inmarket momentum. By examining the progression of higher highs and higher lows (or lower highs and lower lows), you can confirm thetrend direction. Additionally, identifying consolidationpatternscan help you anticipate powerful trend continuations or reversals.
As you become more comfortable reading candlestick charts, you’ll be able to use these sequences to time your entries and exits with greater precision. The key is to stay vigilant and adapt to changing market conditions. As the renowned trader, Steve Nison, once said,
“Candlestick charts are a window into the market’s soul, revealing the psychology of the traders and the underlying forces driving price movements.”
By mastering the art of reading candlestick charts, you’ll gain a valuable edge in the markets and be better equipped to navigate the complexities of trading.
Single Candlestick Patterns and Their Significance
Single candlestick patterns offer valuable insights into market sentiment and potential future movements. These patterns are crucial for traders as they provide a snapshot of market dynamics within a specific time frame. I’ll be exploring three significant single candlestick patterns: Doji, Marubozu, and Spinning Tops.
Doji: The Sign of Market Indecision
A Doji candlestick is characterized by its small or non-existent body, indicating that the opening and closing prices are nearly the same. This pattern signifies market indecision, where neither bulls nor bears have gained control. The presence of a Doji suggests that the market is at a crossroads, and it can be a precursor to a trend reversal or continuation, depending on the context.
Marubozu: Strong Directional Movement
The Marubozu candlestick is recognized by its long body and the absence of shadows, indicating a strong directional movement. A bullish Marubozu has a long white (or green) body, signifying that buyers were in control throughout the session. Conversely, a bearish Marubozu has a long black (or red) body, showing that sellers dominated the session. This pattern is a sign of strong market momentum.
Spinning Tops: Equilibrium Between Bulls and Bears
Spinning Tops are candlesticks with a small real body and long upper and lower shadows. They represent a state of equilibrium between bulls and bears, where both parties are equally active but neither gains the upper hand. This pattern is indicative of market indecision and often appears during consolidation phases before a significant breakout. The presence of Spinning Tops can also signal weakening momentum after strong trend movements.
| Candlestick Pattern | Market Sentiment | Indication |
|---|---|---|
| Doji | Indecision | Potential Reversal or Continuation |
| Marubozu | Strong Directional Movement | Market Momentum |
| Spinning Top | Equilibrium | Consolidation or Weakening Momentum |
Understanding these single candlestick patterns can significantly enhance a trader’s ability to analyze the market and make informed decisions. By recognizing the significance of Doji, Marubozu, and Spinning Tops, traders can better navigate the complexities of the market.
Powerful Bullish Candlestick Patterns
Understanding the nuances of candlestick patterns can greatly enhance a trader’s ability to identify lucrative opportunities, particularly with patterns that signal a strong uptrend. As we explore the world of candlestick analysis, certain patterns stand out for their reliability in indicating a continuation or strengthening of a bullish trend.
Hammer and Inverted Hammer
The Hammer and Inverted Hammer are significant reversal patterns that indicate a potential shift towards a bullish trend. The Hammer forms at the bottom of a downtrend, characterized by a small body and a long lower wick, signifying that sellers were initially in control but were overwhelmed by buyers. The Inverted Hammer, with its long upper wick, suggests a similar dynamic but with an emphasis on the initial push upwards.
Bullish Engulfing Pattern
The Bullish Engulfing Pattern is a two-candlestick formation where the second candle completely engulfs the body of the first, signaling a strong shift in favor of the bulls. This pattern is particularly potent as it indicates that buyers have taken control, potentially marking the beginning of an uptrend.
Morning Star Formation
The Morning Star is a three-candlestick pattern that signals a potential reversal from a downtrend to an uptrend. It begins with a bearish candle, followed by a small-bodied candle, and concludes with a strong bullish candle. This formation indicates a gradual shift in control from sellers to buyers.
Rising Three Methods
The Rising Three Methods is a candlestick pattern that signifies a temporary consolidation before the prevailing uptrend resumes. It consists of a strong bullish candle, followed by three or more smaller bearish candles that remain within the range of the first candle, and concludes with another strong bullish candle. This pattern represents a brief period of profit-taking without significant selling pressure, confirming that buyers are ready to push prices higher.
By recognizing these powerful bullish candlestick patterns, traders can gain valuable insights into market sentiment and make more informed decisions. Whether it’s the Hammer, Bullish Engulfing, Morning Star, or Rising Three Methods, each pattern offers a unique perspective on the battle between bulls and bears, helping traders navigate the markets with greater confidence.
Key Bearish Candlestick Patterns
The ability to recognize key bearish candlestick patterns can be a game-changer for traders aiming to stay ahead of the curve. As we explore these patterns, you’ll gain insights into how to identify potential downtrends and make informed trading decisions.

Hanging Man and Shooting Star
The Hanging Man and Shooting Star are two significant bearish reversal patterns. The Hanging Man appears during an uptrend and is characterized by a small body with a long lower wick, indicating a potential reversal. The Shooting Star, on the other hand, has a small body with a long upper wick, signaling that buyers are losing control.
Bearish Engulfing Pattern
A Bearish Engulfing Pattern occurs when a large bearish candle engulfs the previous bullish candle, indicating a shift in market sentiment. This pattern suggests that sellers have taken control, potentially leading to a downtrend.
Evening Star Formation
The Evening Star is a three-candle pattern that signals a potential reversal. It begins with a large bullish candle, followed by a small-bodied candle, and concludes with a large bearish candle. This formation indicates that the uptrend is losing momentum.
Falling Three Methods
The Falling Three Methods is a bearish continuation pattern that indicates a temporary consolidation before the downtrend resumes. It consists of a strong bearish candle, followed by three or more smaller bullish candles that stay within the range of the first candle, and finally, another strong bearish candle that closes below the first candle’s close. This pattern represents short covering rather than actual buying pressure, and the final bearish candle confirms that sellers have regained control.
- The Falling Three Methods pattern is one of the most reliable continuation signals during an established downtrend.
- It represents temporary bounces within a larger bearish move, where small bullish candles are contained within the range of the first bearish candle.
- Professional traders use this pattern to add to short positions with excellent risk-reward potential.
By understanding and identifying these key bearish candlestick patterns, traders can enhance their ability to navigate complex market conditions and make more informed decisions.
Continuation Patterns in Candlestick Charts
I’ve found that mastering continuation patterns in candlestick charts can be a game-changer for traders looking to ride the trend. Continuation patterns are formations that indicate a pause or a brief consolidation in the prevailing trend before it continues in the same direction. Understanding these patterns can help traders make more informed decisions and potentially increase their profitability.
Continuation patterns are essential for traders because they provide insight into the market’s sentiment and potential future movements. By recognizing these patterns, traders can better position themselves to take advantage of the ongoing trend.
Harami Patterns: Signs of Consolidation
A Harami pattern is a type of continuation pattern that signifies consolidation in the market. It is characterized by a large candlestick followed by a smaller candlestick whose body is completely within the range of the larger candle’s body. The Harami pattern suggests that the market is pausing before potentially continuing its trend. This pattern can be particularly useful for traders looking to enter or add to a position in the direction of the prevailing trend.
The Harami pattern comes in two forms: bullish and bearish. A bullish Harami occurs during a downtrend, indicating a potential continuation of an uptrend, while a bearish Harami occurs during an uptrend, suggesting a continuation of a downtrend. Recognizing these patterns can help traders anticipate the next significant move in the market.
Windows (Gaps): Potential Continuation Signals
In candlestick analysis, gaps are referred to as “windows” and can serve as continuation signals when they occur in the direction of the prevailing trend. A window is essentially a gap between two candlesticks where no trading has occurred, creating potential support or resistance zones. Gaps can be powerful indicators of the trend’s strength and potential continuation.
There are different types of gaps, including breakaway gaps, measuring gaps, and exhaustion gaps, each with its own implications for future price movements. For instance, a breakaway gap at the beginning of a trend can signal a strong move, while an exhaustion gap near the end of a trend might indicate a reversal.
By understanding and identifying these gaps, traders can gain valuable insights into market dynamics and make more informed trading decisions. Whether it’s a breakaway gap signaling the start of a new trend or a measuring gap indicating the trend’s continuation, recognizing these patterns can be a valuable tool in a trader’s arsenal.
The Role of Shadows in Candlestick Analysis
In the world of candlestick charting, shadows are more than just lines – they reveal the underlying market psychology. As a trader, understanding the role of shadows can provide valuable insights into the dynamics between buyers and sellers.
Candlesticks with a long upper shadow and short lower shadow indicate that buyers dominated during the session, bidding prices higher, but sellers ultimately forced prices down from their highs. Conversely, candlesticks with long lower shadows and short upper shadows show that sellers drove prices lower, but buyers resurfaced to bid prices higher by the end of the session.
Long vs. Short Shadows: What They Tell Traders
The length of a shadow relative to the candlestick’s body can tell traders a lot about the market sentiment. Long shadows indicate a significant price movement beyond the opening and closing prices, showing that either buyers or sellers were aggressive. Short shadows, on the other hand, suggest that the price movement was more contained.
| Shadow Type | Indication |
|---|---|
| Long Upper Shadow | Sellers overpowered buyers, pushing prices down |
| Long Lower Shadow | Buyers countered sellers, pushing prices up |
| Short Shadows | Little contention between buyers and sellers |
Shadow Positioning and Market Psychology
The positioning of shadows across multiple candlesticks can reveal the psychological battle between buyers and sellers. By examining shadow positioning, traders can gain insights into market psychology and anticipate potential price movements. For instance, a series of candlesticks with long lower shadows may indicate a strong buying interest at lower prices.

By understanding shadow analysis, traders can identify optimal entry and exit points with favorable risk-reward ratios. Recognizing specific shadow formations can also provide high predictive value for future price direction.
Candlestick Positioning and Pattern Recognition
Candlestick positioning and pattern recognition are essential skills for traders looking to gain an edge in the market. By understanding how candlesticks are positioned and the patterns they form, traders can gain valuable insights into market dynamics.
The position of a candlestick relative to the previous one can signal various market conditions. Two significant positions are the “Star Position” and the “Harami Position,” each providing unique insights into market sentiment and potential future movements.
Star Position: Gaps and Their Significance
A candlestick is said to be in the “Star Position” when it gaps away from the previous candlestick’s body. This gapping can be either upward or downward and is significant because it often indicates a strong shift in market sentiment. The appearance of a star pattern can signal a potential reversal or continuation, depending on the context in which it appears.
Harami Position: The Pregnant Formation
A candlestick that forms within the real body of the previous candlestick is in the Harami position. The term “Harami” is Japanese for “pregnant,” aptly describing the second candlestick being nestled inside the first. Typically, the first candlestick has a large real body, while the second has a smaller real body. The Harami position signals a significant reduction in market volatility and can indicate either a continuation or a reversal, depending on the subsequent market action.
The Harami pattern often appears after strong trend moves, representing diminishing conviction in the current trend. By recognizing Harami patterns, traders can adjust their position management and risk parameters to maximize profit potential while managing risk.
To effectively trade Harami formations, it’s crucial to distinguish between those that lead to reversals and those that indicate temporary consolidation. Professional traders use these patterns to refine their trading strategies, and by doing so, they can better navigate the complexities of the market.
Blending Candlesticks for Enhanced Analysis
I have found that blending candlesticks is a game-changer for traders seeking to cut through market noise. By simplifying complex candlestick patterns, traders can gain a clearer understanding of market trends and make more informed decisions.
Combining Multiple Candlesticks into One
Blending multiple candlesticks into one involves taking the open of the first candle, the high of the entire pattern, the low of the entire pattern, and the close of the last candle. This creates a new candlestick that captures the essence of the original pattern.

Pattern Essence and Simplified Interpretation
The blended candlestick reveals the core market psychology behind complex multi-candle formations. By eliminating session-specific noise, traders can focus on the true significance of price movements. This approach leads to more confident trading decisions and fewer missed opportunities.
- Simplified interpretation leads to more accurate trading decisions.
- Blending candlesticks helps identify the true significance of price movements.
- Professional traders use pattern essence analysis to develop a more intuitive understanding of market dynamics.
By applying this simplified approach to your trading, you can improve both accuracy and efficiency. Blending candlesticks is a powerful technique that enhances your analysis and helps you stay focused on what truly matters in the markets.
Comparing Candlestick Charts to Other Chart Types
While candlestick charts are widely used, other chart types can offer unique insights under certain market conditions. As a trader, it’s essential to understand the strengths and weaknesses of different chart types to make informed decisions.
Advantages Over Bar and Line Charts
Candlestick charts provide a visual representation of price movements that can be more intuitive than bar charts or line charts. The color coding and body shape of candlesticks offer immediate clues about market sentiment. However, line charts can be useful for identifying overall trends without the “noise” of intra-period price movements.
In certain situations, bar charts might be preferable, especially when you want price information without the visual dominance of candlestick bodies. Bar charts provide a middle ground between the detailed information of candlesticks and the simplicity of line charts.
When to Use Different Chart Types
There are specific scenarios where alternative chart types might be more appropriate. For instance, line charts are ideal for long-term trend analysis, as they help filter out the noise and focus on the overall direction. On the other hand, point and figure charts can offer unique insights for certain trading strategies that complement candlestick analysis.
Professional traders often switch between chart types depending on their analytical needs. By combining multiple chart types, you can gain a more comprehensive view of market conditions. For example, using line charts to identify support and resistance levels can be particularly useful when these levels are obscured by the visual complexity of candlesticks.
Practical Applications of Candlestick Charts in Trading
Understanding the practical applications of candlestick charts can significantly enhance your trading decisions. Candlestick formations, when used alongside other technical analysis indicators and support and resistance levels, can effectively flag and confirm short-term market turning points. This integration of candlestick analysis with other trading tools enables traders to make more informed decisions.
Trend Identification and Confirmation
Candlestick patterns play a crucial role in identifying and confirming market trends. Specific patterns, such as thebullish engulfing patternand thehammer, can signal the beginning of an upward trend. Conversely, patterns like thebearish engulfing patternand theshooting starcan indicate the start of a downward trend. By recognizing these patterns, traders can confirm the direction of the market trend and adjust their strategies accordingly.
| Candlestick Pattern | Trend Indication | Market Implication |
|---|---|---|
| Bullish Engulfing | Upward Trend | Potential buying opportunity |
| Hammer | Reversal/Upward | Buying pressure |
| Bearish Engulfing | Downward Trend | Potential selling opportunity |
| Shooting Star | Reversal/Downward | Selling pressure |
Support and Resistance Level Recognition
Candlestick charts are also invaluable for identifying support and resistance levels. For instance,hammer patternsand long lower shadows often indicate buying pressure at key support levels. On the other hand,shooting starsand long upper shadows can pinpoint resistance levels where selling pressure emerges. Clusters ofdoji candlesticksat these levels can further confirm their significance as decision points in the market.
By combining candlestick analysis with the recognition of support and resistance levels, traders can identify high-probability trading opportunities. The rejection of price levels shown in candlestick shadows can also be used to fine-tune support and resistance analysis, allowing for more precisestop-lossandtake-profitlevels.
Advanced Candlestick Techniques for Experienced Traders
For those who have mastered the basics of candlestick charting, it’s time to explore advanced techniques that can elevate your trading to the next level. As traders, we’re constantly seeking ways to refine our strategies and improve our decision-making processes. One effective way to do this is by combining candlestick patterns with other forms of analysis.
Combining Candlesticks with Technical Indicators
When you combine candlestick patterns with technical indicators, you can significantly enhance the reliability of your trading signals. Technical indicators such as moving averages, Relative Strength Index (RSI), and Bollinger Bands can provide additional confirmation for the signals generated by candlestick patterns. For instance, if a bullish engulfing pattern occurs at a key support level and is accompanied by a bullish crossover on the RSI, it can be a strong buy signal. The key is to find confluence between different indicators and candlestick patterns to increase the probability of a successful trade.
Volume Analysis with Candlestick Patterns
Volume analysis can provide important confirmation for candlestick patterns. High volume accompanying a pattern generally increases its significance and reliability as a trading signal. For example, a hammer candlestick pattern on high volume is more likely to be a reversal signal than the same pattern on low volume. By analyzing volume in relation to specific candlestick patterns, traders can determine their validity and potential strength. It’s also worth noting that declining volume during continuation patterns often signals weakening momentum before price reversals.
To incorporate volume analysis into your candlestick trading, focus on the volume bars that accompany significant candlestick patterns. High volume on reversal patterns often indicates stronger conviction and more significant price movements. Additionally, volume spikes with specific candlestick patterns can help identify institutional participation, which can be a powerful confirmation of the pattern’s validity.
Common Mistakes to Avoid When Reading Candlestick Charts
To maximize the effectiveness of candlestick chart reading, traders need to be aware of and avoid several common mistakes. While candlestick patterns can provide valuable insights into market trends and potential reversals, relying solely on these patterns without considering the broader market context can lead to suboptimal trading decisions.
Overreliance on Single Patterns
One of the most significant mistakes traders make is putting too much weight on a single candlestick pattern. Even the most reliable patterns can fail if they conflict with the overall market trend or other technical indicators. For instance, a bullish engulfing pattern might suggest a buying opportunity, but if it occurs during a strong downtrend, it might be a false signal. I always advise traders to look for confirmation from other patterns or indicators before making a trade based on a single candlestick formation.
Ignoring the Broader Market Context
Ignoring the broader market context is another critical error. Understanding the market’s overall trend, sector performance, and economic conditions is essential for accurately interpreting candlestick patterns. For example, a candlestick pattern that typically indicates a reversal might be less reliable during times of high market volatility or when significant economic news is about to be released. By considering the bigger picture, traders can better assess the significance of any candlestick pattern and make more informed decisions.
To avoid these mistakes, it’s essential to adopt a top-down analytical approach. This involves starting with the broader market analysis, considering multiple timeframes, and then focusing on specific candlestick signals. By doing so, traders can enhance their analysis and make more effective trading decisions.
Limitations of Candlestick Analysis
While candlestick analysis is a powerful tool, it’s essential to understand its limitations to avoid potential pitfalls. As a trader, I’ve learned that relying solely on candlestick patterns can be misleading. Let’s explore some of the key limitations and how to address them.
Short-Term Focus vs. Long-Term Investing
Candlestick patterns are primarily used for short-term trading decisions. However, for long-term investors, these patterns may not provide the complete picture. For instance, a bullish candlestick pattern might indicate a short-term opportunity, but it may not align with long-term investment goals. To get a more comprehensive view, it’s crucial to combine candlestick analysis with other forms of technical analysis and even fundamental analysis.
The Need for Confirmation and Multiple Indicators
No single candlestick pattern is foolproof. That’s why confirmation from multiple sources is vital. I always recommend using additional indicators to validate candlestick signals. For example, you can check if the candlestick pattern is supported by volume analysis or if it aligns with key support and resistance levels. By doing so, you can significantly increase the reliability of your trading decisions.
In conclusion, while candlestick analysis is a valuable tool, it’s not without its limitations. By understanding these limitations and using multiple indicators for confirmation, traders can make more informed decisions.
Conclusion: Mastering the Art of Candlestick Chart Reading
The world of candlestick charts is rich with insights, and with consistent practice, you can unlock their full potential. Throughout this guide, we’ve explored the intricacies of candlestick analysis, from understanding the anatomy of a candlestick to recognizing complex patterns and integrating them into your trading strategy.
To develop your candlestick reading skills, it’s essential to practice consistently and observe pattern outcomes carefully. Remember, mastering candlestick analysis is a journey that requires patience, discipline, and continuous learning. By combining the knowledge from each section of this guide, you’ll create a powerful framework for market analysis that can significantly enhance your trading decisions.
Professional traders often integrate candlestick analysis into their overall trading methodology, using it in conjunction with other technical tools to confirm signals and identify trends. As you continue to develop your expertise, you’ll discover how to apply these techniques effectively in various market conditions.
In conclusion, candlestick chart analysis can transform your trading by providing clearer insights into market psychology. I encourage you to start applying these techniques immediately, maintaining realistic expectations about their capabilities and limitations. With dedication and persistence, you’ll become proficient in reading candlestick charts and enhance your trading performance.